data visualisation
-
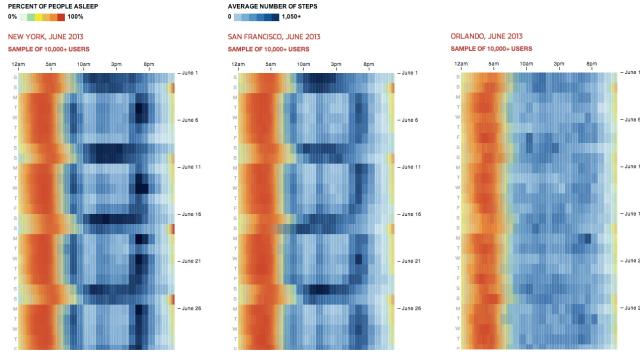
People In Melbourne Sleep More Than Anyone Else, According To Jawbone

People in Melbourne get the most, those in Tokyo the least. No, get your mind out of the gutter: we’re talking about sleep here, and how much of it the inhabitants of certain cities manage to actually get.


-
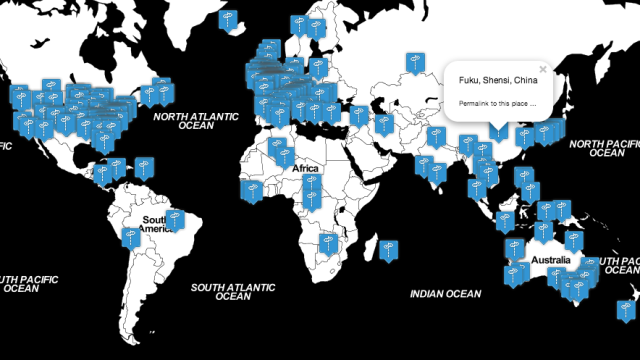
The World’s Offensive Place Names, Mapped

We’ve all sat in the passenger seat, notionally giving directions to a driver and giggling at the slightly rudely named towns on the map. Fortunately, now you can find all those amusingly offensive place names, across the entire world, on one wonderfully juvenile interactive map. Maybe, perhaps, possibly a little NSFW.

-
An Insanely Detailed Map Of Where People Bike And Run Around The World
Earlier this year, Nathan Yau visualised some of the world’s most popular running routes, but with a fairly limited data set. But the information logged to Strava provides a wildly detailed map of people’s workouts across the entire planet — and now you can explore it to your heart’s content.


-
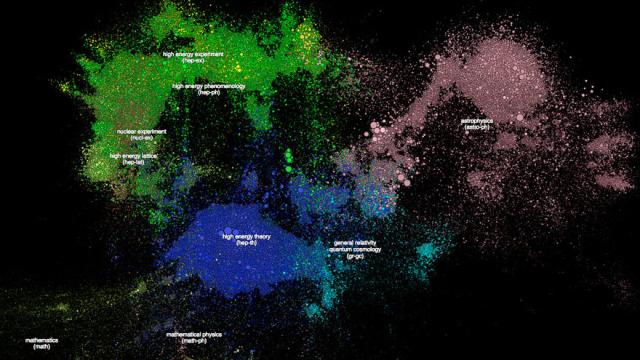
Visualising Published Science As Forming Galaxies
Scientific research is published by the bucketload every single week — to the extent that it’s virtually impossible to keep up with. So this neat way of visualising published papers as growing galaxies is particularly fun — and useful.