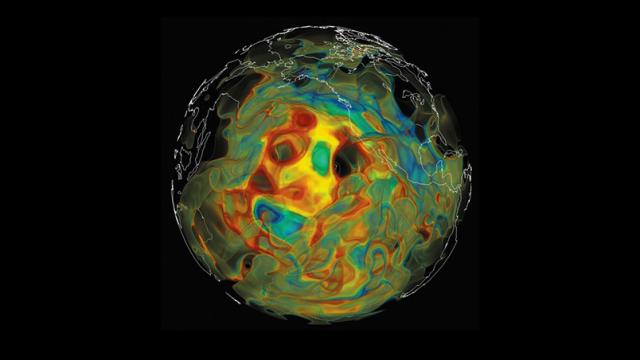
This trippy orb isn’t the result of a youth misspent. Instead, it’s the fruits of complex computer simulations that use the speed of seismic waves from earthquakes to visualise the existence of subterranean structures far beneath the surface of our planet.
Created by Ebru Bozdağ from the University of Nice Sophia Antipolis and David Pugmire of Oak Ridge National Laboratory, the image above shows a view of Earth’s mantle — the semi-solid rock layer that stretches to a depth of 2900km beneath our feet — seen from the Pacific Ocean. Red and orange areas show where seismic waves travel slower; faster waves are shown in green and blue. The areas where waves move fastest are typically the one where tectonic plates sink away beneath another.
With the a growing network of earthquake detection systems now in place, a team of researchers from Princeton, led by Professor Jeroen Tromp, are no seeking to move from theory to reality. In a newly launched project, his team will use real data to create similar visualisations — churning through mountains of numbers at a rate of 20 quadrillion calculations per second using Oak Ridge National Laboratory Titan supercomputer. [Princeton]
Picture: Ebru Bozdağ, University of Nice Sophia Antipolis, and David Pugmire, Oak Ridge National Laboratory