The USDA has released an update to its “food dollar” breakdown — a division of a single dollar into the exact amount every link in the chain receives. So what’s new in the latest data from 2014, over last year’s update? There’s a series of changes, all of which seem to trend towards the same point: America is cooking for itself less and less.
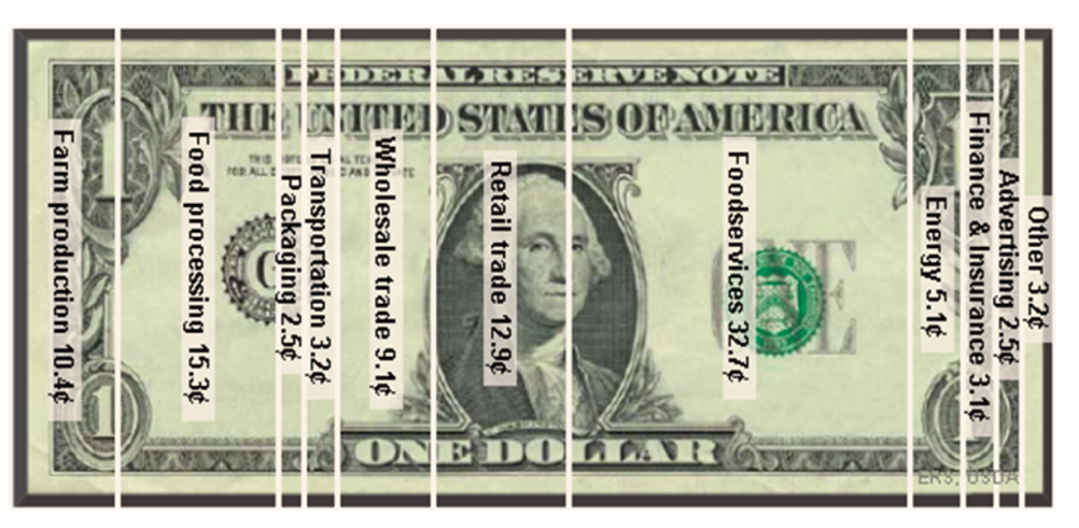
The evidence for America’s declining cooking habits lies in which segments increased and decreased their share of the food dollar. The biggest increase was in the food service expenditure. Actual farming production costs remained precisely stable.
The categories that dropped off to make room for the increase in food service costs weren’t on the farm, they were instead heaviest in packaging, transportation and wholesale trades — all costs that would be mostly associated with shopping at supermarkets.
Looking at other data also backs up this idea. 2014 was also the year Americans crossed the threshold into spending more money eating out than eating at home. The trend seems to have shown no signs of slowing.
[USDA]
Top image: A produce section, suitably empty of shoppers / rick